
Fig. 5. Chromosomal aberrations in HCC of Mcl-1Δhep mice shown by aCGH analysis.
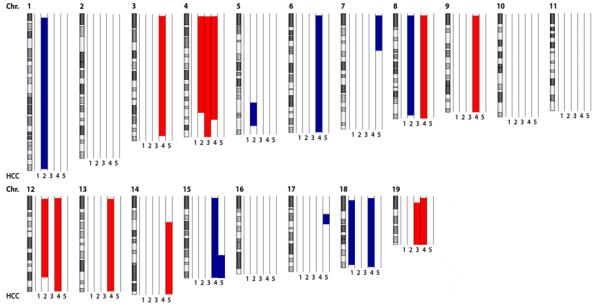
The q-arm of each chromosome is shown and chromosome numbers are indicated. Gray and black bars within the symbolized chromosomes represent G bands. Deletions according to the genomic segmentation workflow are indicated in blue, amplifications in red (see methods for details). HCC of 5 individual Mcl-1hep mice were hybridized and normalized to liver tissue of age-matched wild-type mice and analyzed by aCGH analysis. Columns next to each chromosome represent individual Mcl-1Δhep HCC (1, 2, 3, 4, 5).