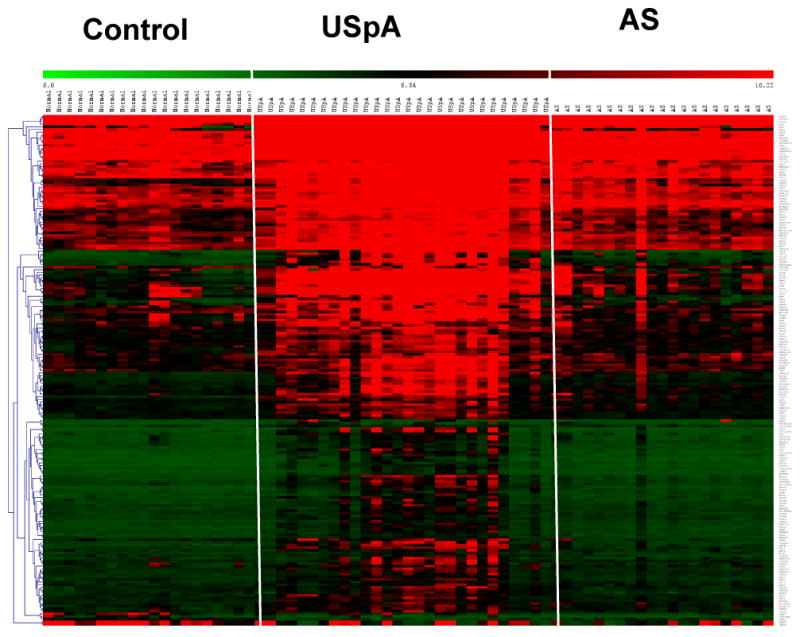
Figure 1.

Heat map of microarray results. For clarity, the three groups of subjects were separated by white margins. The genes were hierarchically clustered by average group linkage. Each column represents one subject, and each row one gene. The red, green and black colors indicate high, low and mid expression levels respectively.
