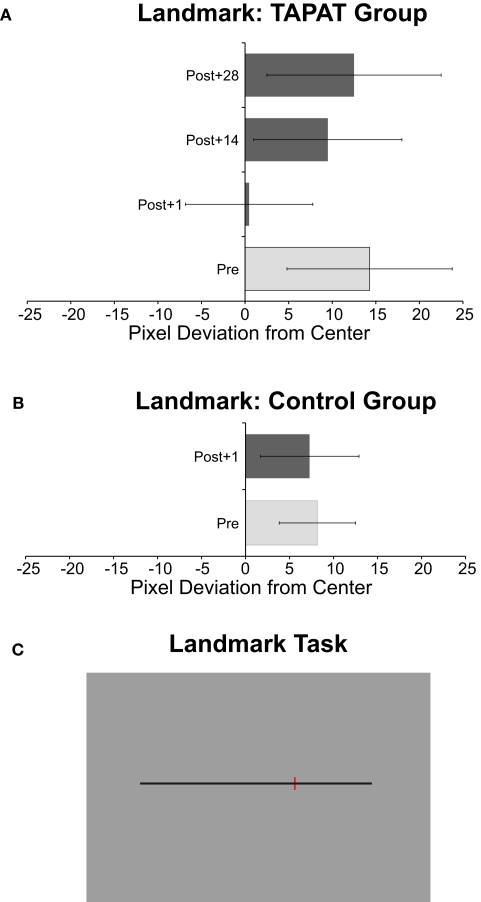
Figure 6.
Group landmark results for TAPAT (A) and Control (B) groups. The pixel deviation from center measures patients’ subjective perception of the center of the black line compared to the actual center (left is negative, right is positive). Error bars represent the standard error of the mean. (C) is an example of a landmark display.

