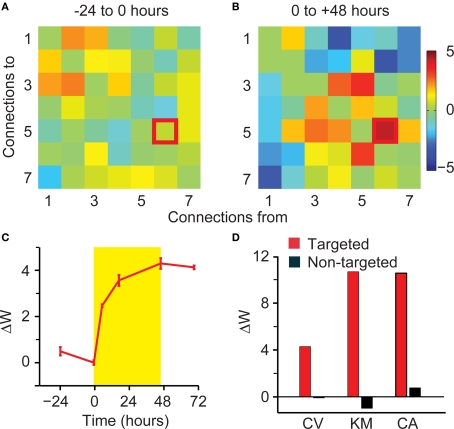
Figure 9.
Network-wide potentiation effects in rate-limited experiments. (A) ΔW matrix for the period from −24 to 0 h for the rate-limited, 5-ms latency stimulation. (B) Results for the period from 0 to 48 h after the onset of rate-limited stimulation at 5-ms latency. (C) Timecourse of trigger-to-target ΔW. (D) Summary of ΔW for targeted (red) and the average of all non-targeted connections (black).

