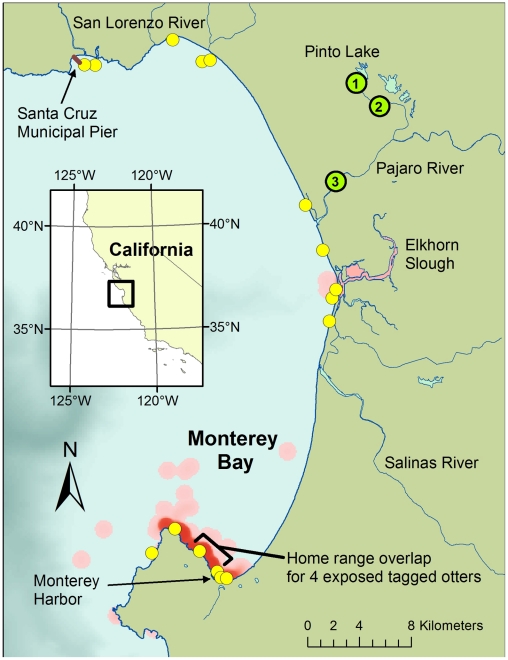
Figure 4. Map of Monterey Bay showing distribution of sea otters dying due to microcystin intoxication (yellow circles).
Note spatial association of sea otter strandings with coastal locations of river mouths, harbors, coastal ponds and embayments. Habitat utilization distributions for 4 radio-tagged, microcystin-poisoned otters are plotted as kernel density distributions fit to daily re-sighting locations (red shading, with regions of most intense shading corresponding to the habitats most frequently utilized by affected animals). Locations of freshwater samples collected during a “Super-bloom” of Microcystis in 2007 are indicated by green circles, with numbers that correspond with the microcystin concentrations listed in Figure 1.

