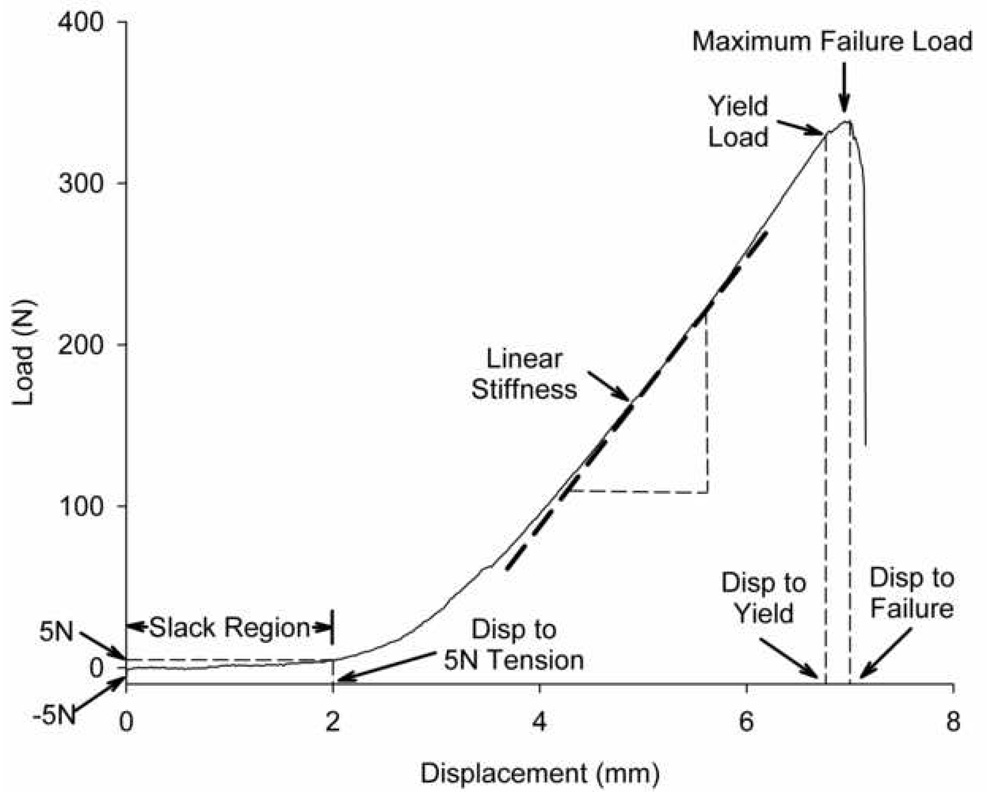
Fig. 2.
Schematic of the load-displacement curve from the mechanical testing demonstrating the key mechanical parameters used to evaluate the function of the repair groups. The slack region is designated as the displacement from 5N of compression on the joint to 5N of tension. The linear stiffness is calculated as the slope of the load-displacement curve between the points corresponding to 20% and 80% of the yield load. Yield load is defined as the point where the load-displacement curve becomes non-linear and failure load is the maximum load supported by the sample before failure. Figure used with permission.23

