
Figure 1.
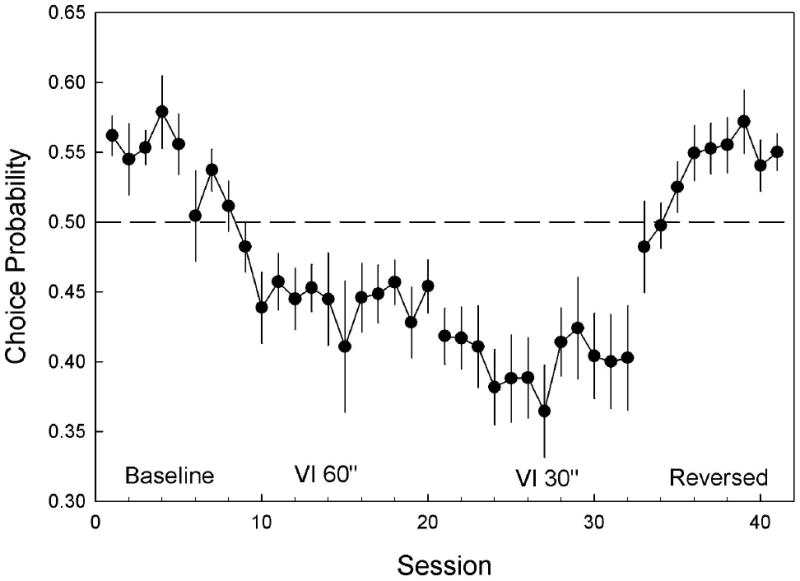
Mean (±SEM) proportion of presses on the lever that was preferred during baseline. The dashed line indicates indifference between levers. Baseline shows the initial proportion of presses on the preferred lever. When bright light was added on a VI 60 schedule, the proportion of responding shifted towards the originally non-preferred lever. When the rate of bright light presentation was increased to a VI 30 schedule a slight further decrease in preference was observed. When the bright light was Reversed onto the originally non-preferred lever, the proportion of responses on the preferred lever again increased. These data show that lever presses were less frequent on the lever that produced light. Results from the Mixed ANOVA are presented in the Experiment 1 results section.