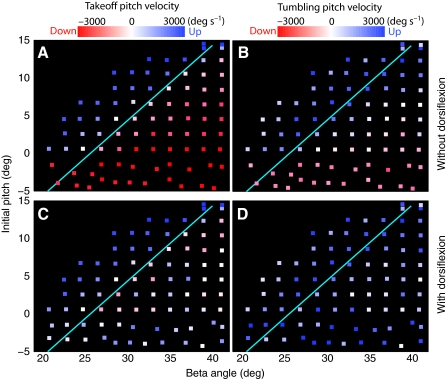
Fig. 8.
Relationship of the take-off and tumbling pitch velocities to the initial pitch and beta angle for simulated jumps. Locust jumps were simulated without (A and B) and with (C and D) dorsiflexion. Take-off pitch velocities (TOPV, left panels in A and C) and tumbling pitch velocities (TUPV, right panels in B and D) are color coded, with more red squares marking jumps with negative (head-downward) pitch velocities, and more blue squares marking jumps with positive (head-upward) pitch velocities. The cyan lines in all four plots are the regression lines of the initial pitch vs take-off angle for the jumps of locust 2 (Fig. 4B).

