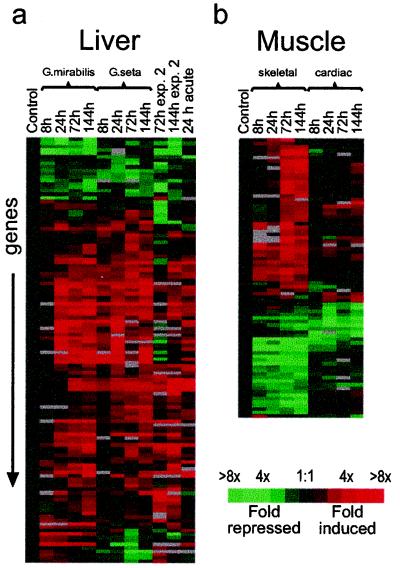
Figure 1.
Cluster images of the hypoxic expression profile in (a) liver and (b) muscle-type tissues. Supplemental expression data for liver are also presented: a repeat hypoxia time course on G. mirabilis (72 and 144 h, experiment 2) and acute exposure of G. seta to 5% pO2 (24 h acute). The expression data for muscle-type tissues are for G. mirabilis. For clarity, just two measurements are shown for genes that were represented by more than one array element. The quantitative changes in gene expression are represented in color: red indicates induced genes, and green indicates repressed genes. Missing data points are represented as gray bars. Expanded annotated figures showing the gene names and associated accession numbers are published as supplemental data on the PNAS web site, www.pnas.org.

