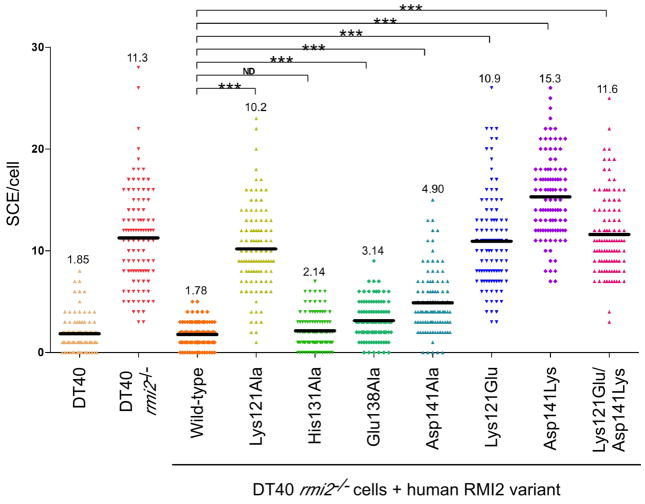
Figure 4. SCE frequencies observed with different RMI2 variants.
The number of SCEs per cell in chicken DT40 cells are shown as a histogram in which each point in a column is the number of SCE events in a single cell. The mean level of SCEs/cell is displayed as a dark black line and numerically at the top of the column. Statistical significance is indicated with *** (p<0.001) and ND (p>0.05). “DT40” denotes wild type DT40 cells, “rmi2−/−” denotes DT40 cells lacking RMI2, “wild-type” denotes rmi2−/− cells complemented with human RMI2 and the remainder denote the human RMI2 variants that have been substituted. See also Figure S3.

