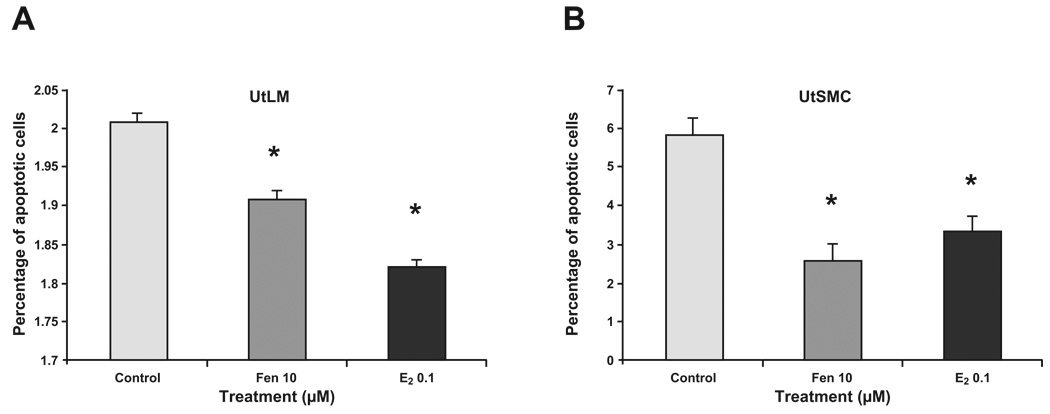
Figure 5. Analysis of apoptosis.
UtLM cells (A) and UtSMCs (B) treated with Fen at 10 µM for 24 h. E2 at a concentration of 0.1 µM was used as a positive control. After treatment, UtLM cells and UtSMCs were harvested, and stained with the apoptotic indicator Annexin V dye and were assayed by FACS flow cytometer. The values represent the percentage of apoptotic cells induced by Fen and E2 to total gated cells. Error bars represent means ± SEM. *p<0.05, Student’s t test (n = 3).

