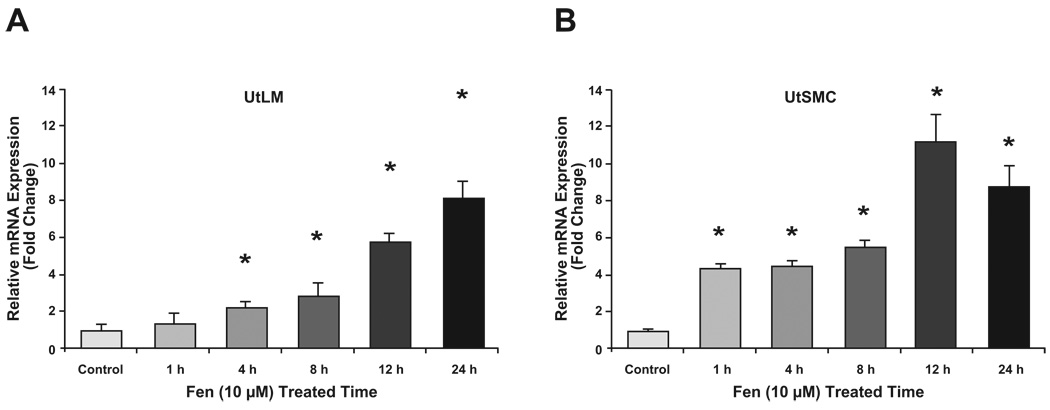
Figure 6. Real-time PCR analysis of Collagen I in UtLM (A) and UtSMC (B) cells.
After treatment with Fen (10 µM) for 0, 4, 8, 12 and 24 h, total RNA was isolated from treated and vehicle control cells and subjected to real-time RT-PCR. Bar graphs show the mean ± SEM of three independent cell cultures. *p<0.05 compared with vehicle controls.

