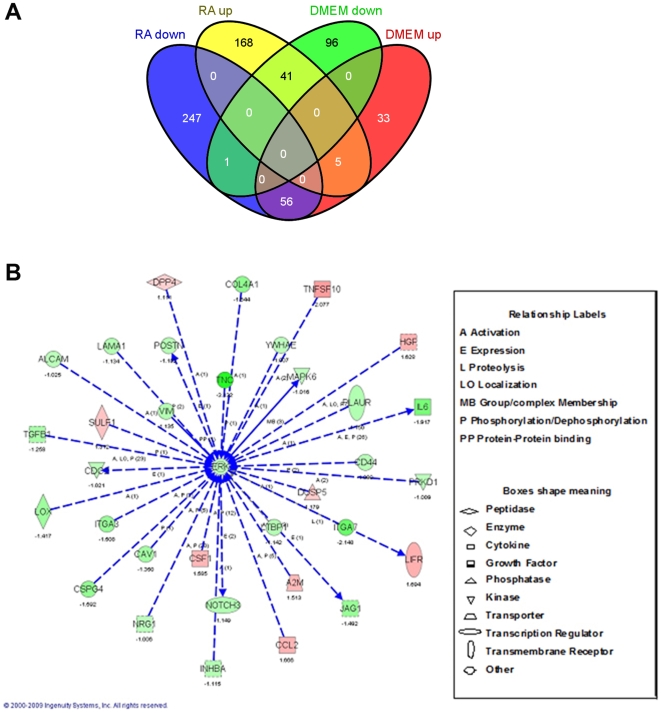
Figure 1. Microarray bioinformatical analysis of the RA effects on hMSC cultured for 5 days without serum.
A: Venn diagram showing the number of differentially expressed transcripts in DMEM and RA treated hMSC when compared to 10%FBS treated cells. B: The genes regulated specifically by RA (i.e. blue or yellow in the diagram depicted in A) were clustered by Ingenuity software. This software contains a database with different transcripts arranged in networks according to their known biological interactions. According to the number of transcripts regulated in each of these networks, the program scores them. The best scored network is depicted here. Direct interactions are represented by continuous arrows and direct by dotted ones. Increase in expression is represented by red color and decrease by green. The number under each transcript name is the logarithmic change in comparison to 10%FBS control cells RNA. The type of interaction is indicated by a label and the type of molecule is indicated by the shape of the box, being both detailed at the right of the figure.

