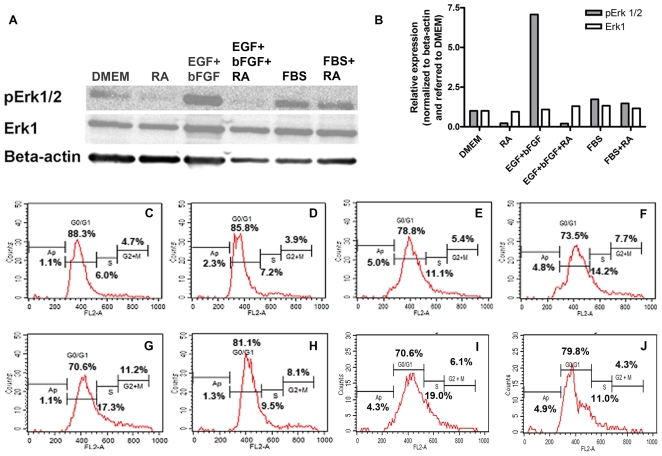
Figure 2. RA and EGF+bFGF effects on Erk phosphorylation and on cell cycle progression.
A: Western blot analysis of hMSC that were cultured for 5 days in either DMEM alone (DMEM) or in the presence of 0.5 µM RA (RA) or in the presence of 20 ng/ml EGF+ 5 ng/ml bFGF (EGF+bFGF), with or without the addition of 0.5 µM RA (EGF+bFGF+RA). As control, cells were cultured with 10%FBS (FBS), or with 0.5 µM RA in 10%FBS (FBS+RA). Whole-cell protein extracts from these differently treated cells were fractionated on a denaturating 12% polyacrylamide gel, transferred to nitrocellulose and detected with anti phosphorylated Erk antibody (pErk1/2). The membrane was stripped twice, one for detection with anti total Erk antibody (Erk1) and the second for β-actin antibody detection used as loading control. B: Densitometry analysis of A. The bars represent relative expression normalized to β-actin expression and referred to this ratio in DMEM. C–J: Cell cycle progression by FACS of hMSC that were cultured for 5 days with DMEM (C), 0.5 µM RA in DMEM (D), 20 ng/ml EGF (E), 5 ng/ml bFGF (F), 5 ng/ml bFGF +20 ng/ml EGF (G), or 5 ng/ml bFGF +20 ng/ml EGF +0.5 µM RA (H). In addition, hMSC were cultured for 2 days in DMEM (I) or in the presence of 0.5 µM RA (J) before replacement of the medium with 20 ng/ml EGF +5 ng/ml bFGF in DMEM for further 2 days. At the end of the experiment the cells were harvested by trypsinization, permeabilized and stained with propidium iodide to measure the DNA content by FACS.

