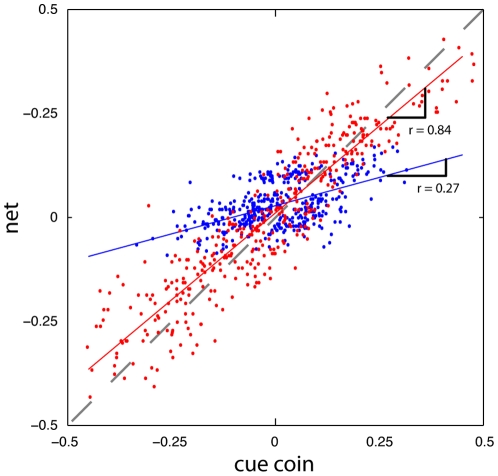
Figure 2. Data from two representative subjects in experiment 1.
For illustrative purposes, the mean of the target coin's prior was removed from the cue coin's positions to center the data. For the subject in group 1A (the red dots), on average the net was placed relatively close to the cue coin (the diagonal represents net = cue coin). For the subject in group 1B (the blue dots), on average the net was placed relatively close to the mean of the target coins (far from the diagonal). Linear fits to all 400 trials of the experiment are shown in the solid red and blue lines. The Bayes' optimal slopes are 0.8 and 0.2.

