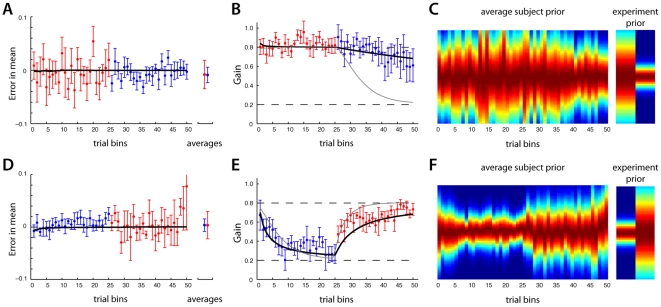
Figure 5. Results from group 2.
Group 2A's results (large variance first) are in the top row and group 2B's results (small variance first) are in the bottom row. A), D) The error in the estimated mean of the prior, over the course of the experiment (each bin is 10 consecutive trials) averaged over subjects (mean +/− standard error). The far right is the average over subjects and trials. B), E) The gain, r, subjects used during the experiment, averaged across subjects. The bold black line indicates the Bayesian inference model's prediction for the experimental data. For comparison, the grey line is the prediction of a fixed learning rate linear filter model C), F) Inferred average prior as it evolved over the experiment.

