
Fig. 8.
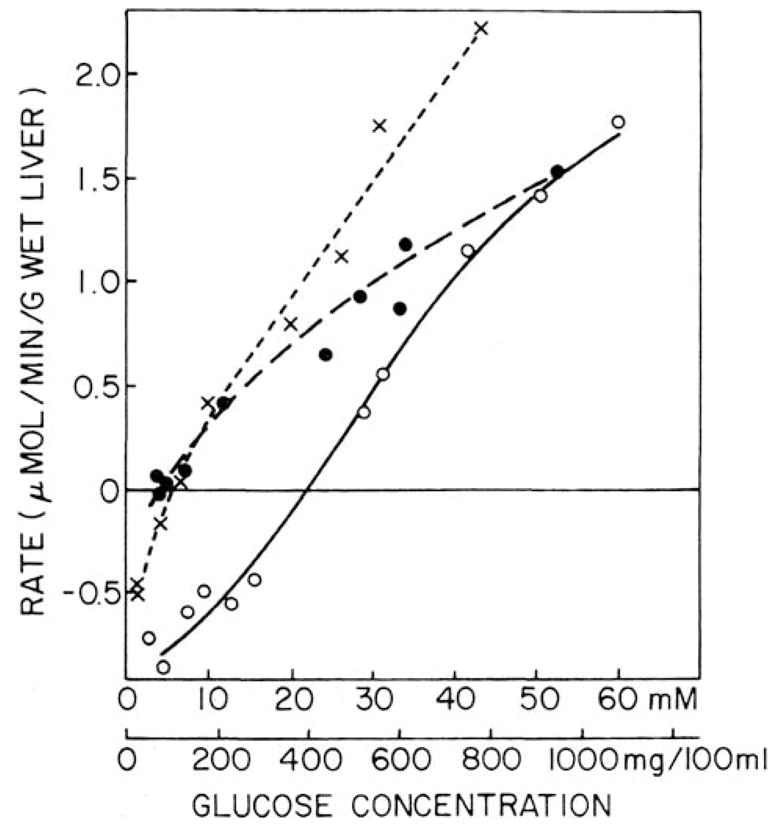
Effects of varied glucose concentrations on net uptake rates in perfused livers from fed control (X) and glucagon-treated alloxan-diabetic rat livers perfused in the absence (O) and presence (□) of 4 mM 3-mercaptopicolinate. Data for diabetic livers are from Tables I and III of Nordlie et al. 1982. Those for controls, included for reference, are from Alvares and Nordlie 1977. Cross-over points from net glucose production to net glucose utilization were observed at 6 mM, 22 mM, and 4 mM glucose with livers from control, diabetic, and mercatopicolinate-supplemented diabetic preparations, respectively. (Reprinted from Nordlie et al. 1982; by permission from Elsevier SV).