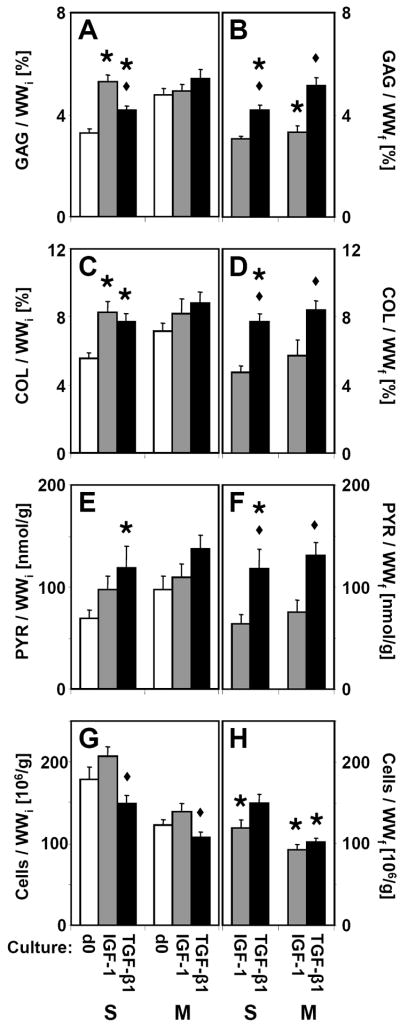
Figure 3.
(A, B) Glycosaminoglycan, (C, D) collagen, (E, F) pyridinoline crosslinks, and (G, H) cellularity of superficial and middle cartilage explants analyzed on day 0 (d0) or following 12 days culture with IGF-1 or TGF-β1. Data are normalized to (A, C, E, G) initial wet weight (WWi) to indicate constituent content or (B, D, F, H) final wet weight (WWf) to indicate constituent concentration. For d0 samples, WWi = WWf, and the data is presented once. For each tissue layer, * indicates a culture group is different from d0 (p<0.05), and ◆ indicates d12 IGF-1 is different from d12 TGF-β1 (p<0.05). Mean ± SE; n=11–18.

