
Figure 8.
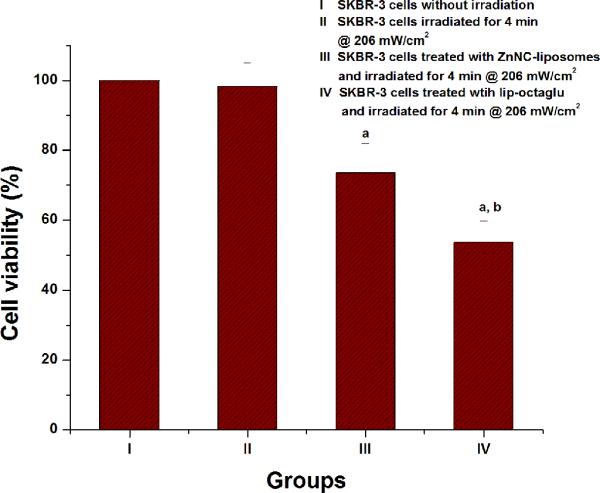
% cell viability observed for a) Group I – SKBR-3 cells without irradiation b) Group II – SKBR-3 cells with irradiation for 4 min @ 206 mW/cm2, c) Group III – treated with 250 μl ZnNC- liposomes (1.6×10⁻⁴ g/ml (1.8 × 10⁻¹⁰ M) lipids) and d) Group IV – 250 μl nanowebs (e.g., lip-octaglu at L/P = 6.7). The cell viability was measured using MTT assay, the standard errors calculated using SPSS 10.0. a,bP<0.05 was observed by Students T-Test where a indicates: Group I was compared with Group III and Group IV and b indicates: when Group III was compared with Group IV.