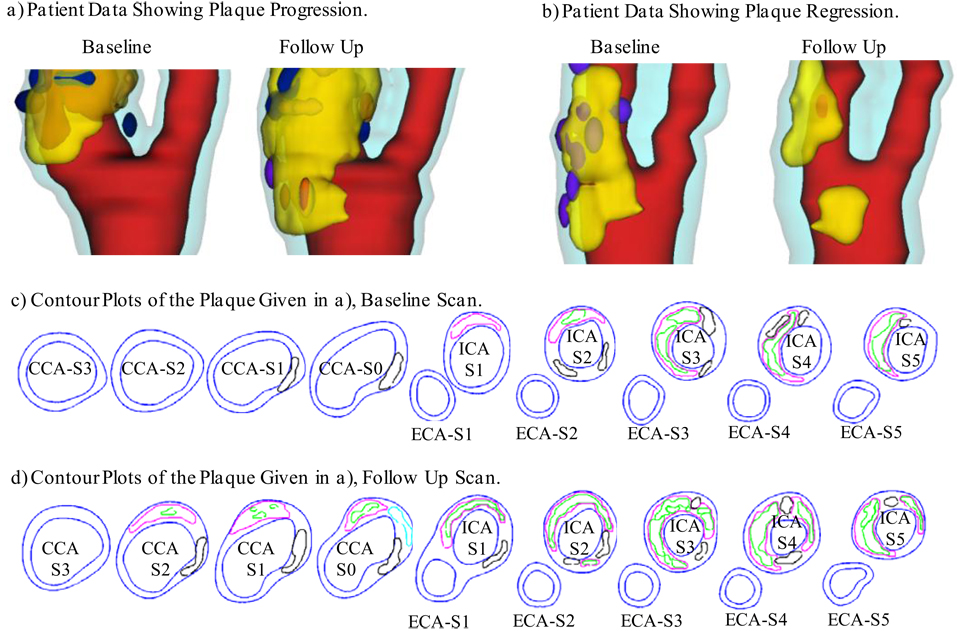
Figure 1.
3D plaque samples re-constructed from in vivo MR images showing progression and regression. (a): one sample showing plaque growth; (b): one sample showing plaque reduction. Scan time interval: 18 months. Red: lumen; Yellow: lipid; Dark blue: calcification; light blue: outer wall. (c) and (d): Contour plots of the plaque given in a). Black: Calcification; Magenta: lipid core. Some hemorrhage (green) were found inside lipid cores.

