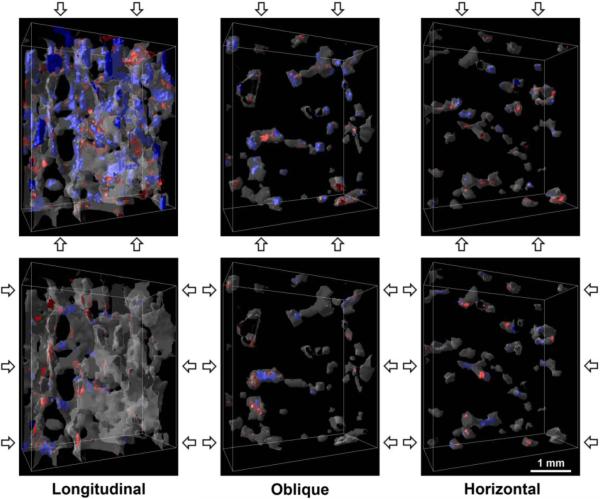
Figure 2.
Renderings of the longitudinal, oblique, and horizontal trabeculae within a 3.6 × 1.6 × 4.2 mm3 subregion of a representative sample. Blue regions indicate tissue yielded due to compressive strain and red due to tensile strain. The top row of images show the results for on-axis compression to 1.2% apparent strain, and the bottom row for transverse compression, as indicated by the arrows.

