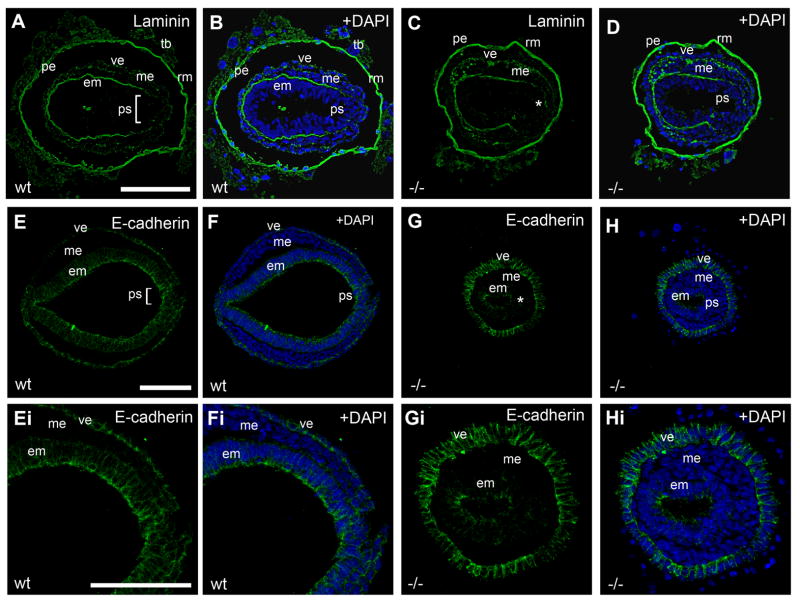
Figure 5. Loss of Pofut2 resulted in expanded EMT.
(A–H) Immunofluorescence analysis of E 7.5 wildtype (A–B, E–F) and RST434 mutant (C–D, G–H) embryos stained with anti-Laminin (Green) (n=3) (A–D) or anti-E-cadherin (Green) (n=3) antibody (E–H). Panels Ei–Hi represent higher magnification of sections shown in E–H. E-cadherin (Green) was dramatically down regulated in the mutant embryonic ectoderm. Nuclei are visualized with DAPI (Blue). White bracket and asterisk denotes the primitive streak in wild type embryos and Pofut2 mutant embryos, respectively. em, embryonic ectoderm; me, mesoderm; pe, parietal endoderm; ps, primitive streak; rm, Reichert’s membrane; tb, trophoblast; ve, visceral endoderm. Anterior is left; posterior is right. Scale bars sizes are indicated in μm.

