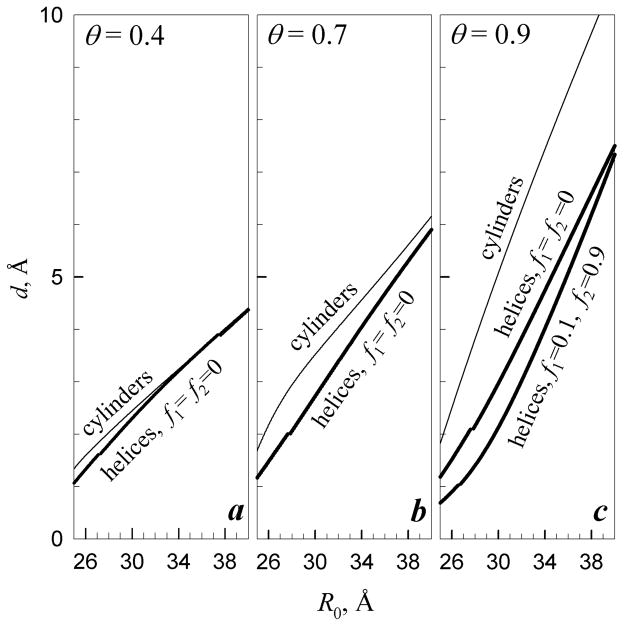
Figure 2.
Effect of counterion binding on undulation amplitude. (a) θ = 0.4, (b) θ = 0.7, (c) θ = 0.9. Thin lines show root mean square (rms) displacement d of molecules with homogeneous surface charge density (cylinders). Bold lines show d for molecules with DNA-like density of fixed surface charges (helices) and random (f1=f2 = 0) or preferential counterion binding in the major groove (f1 = 0.1 and f2 = 0.9). Small breaks in the bold lines are associated with phase transitions in mutual alignment of the helices (Fig. 3). The calculations were performed based on Eqs. (S.43)–(S.49) reported in the online supplement with a = 11.2 Å, lc=1.7 Å, λD ≈ 7 Å (0.15 M, 1:1 electrolyte in the bulk solution), lB ≈ 7 Å (ε = 80), , and λc = 105 Å ( and ).

