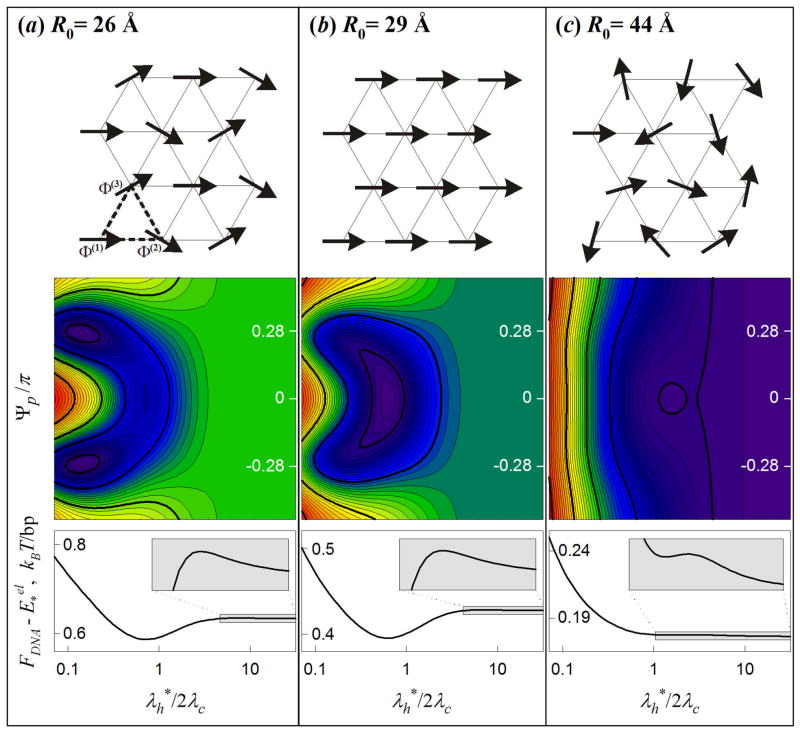
Figure 3.
Phase states of DNA aggregates. (a) Potts state: The molecules have the same set of three different helical phases Φ̄(1), Φ̄(2) and Φ̄(3) (Φ̄(1) -Φ̄(2) = Φ̄(3) -Φ̄(1) = Ψp) within each triangle of the hexagonal lattice (top picture). (b) Ferro state: All molecules have the same helical phase (Ψp =0). (c) Random state: The helical phases are random. Color contour plots illustrate the dependence of the free energy FDNA (in log scale) on Ψp and normalized structural adaptation length ( , Eq. (34)). Bottom graphs show the dependence of FDNA on at Ψp =0; the insets enlarge the boxed, shaded regions. FDNA may have up to three distinct minima: and Ψp ~ ± π/4 is the Potts state [global minimum in (a)]; and Ψp = 0 is the ferro state [global minimum in (b), local minimum in (a) and (c)]; and arbitrary Ψp is the random state [global minimum in (c), local minimum in (a) and (b)]. The calculations were performed at θ = 0.7 and f1=f2=0 with the same values of other parameters as in Fig. 2.

