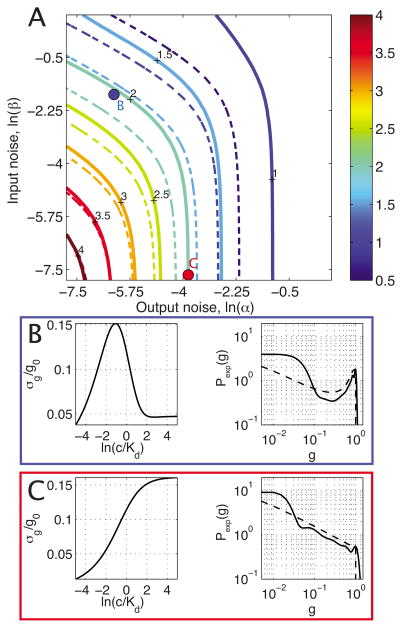
FIG. 3.
(Color online) Information capacity (color code, in bits) as a function of input and output noise using the activator input-output relation with Gaussian noise given by Eq. (20) and no cooperativity (h = 1). (a) shows the exact capacity calculation (thick line) and the small-noise approximation (dashed line). (b) displays the details of the blue point in (a): the noise in the output is shown as a function of the input, with a peak that is characteristic of a dominant input noise contribution; also shown is the exact solution (thick black line) and the small-noise approximation (dashed black line) to the optimal distribution of output expression levels. (c) similarly displays details of the system denoted by a red dot in (a); here the output noise is dominant and both approximate and exact solutions for the optimal distribution of outputs show a trend monotonically decreasing with the mean output.

