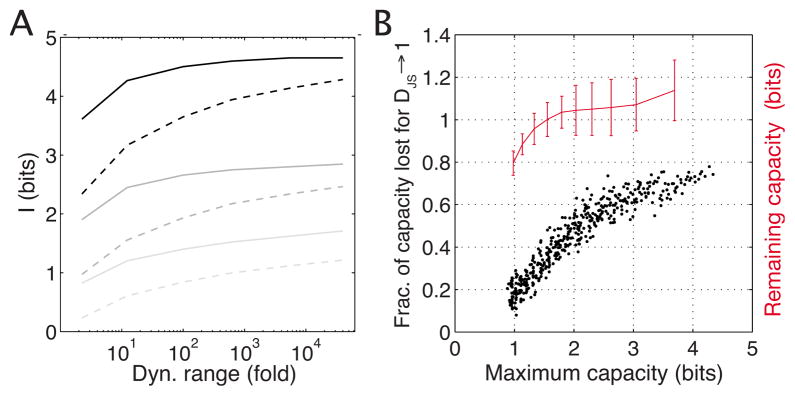
FIG. 6.
(Color online) Effects of imposing realistic constraints on the space of allowed input distributions. (a) shows the change in capacity if the dynamic range of the input around Kd is changed (“25-fold range” means c ∈ [Kd/5,5Kd]). The regulatory element is a repressor with either no cooperativity (dashed line) or high cooperativity h=3 (thick line). We plot three high-low cooperativity pairs for different choices of the output noise magnitude (high noise in light gray, ln α ≈ −2.5; medium noise in dark gray, ln α ≈ −5; low noise in black, ln α ≈ −7.5). (b) shows the sensitivity of channel capacity to perturbations in the optimal input distribution. For various systems from Fig. 3 we construct suboptimal input distributions, as described in the text, compute the fraction of capacity lost relative to the unperturbed optimal solution, and plot this fraction against the optimal capacity of that system (black dots); extrapolated absolute capacity left when the input tends to be very different from optimal, i.e., DJS → 1, is plotted in red.

