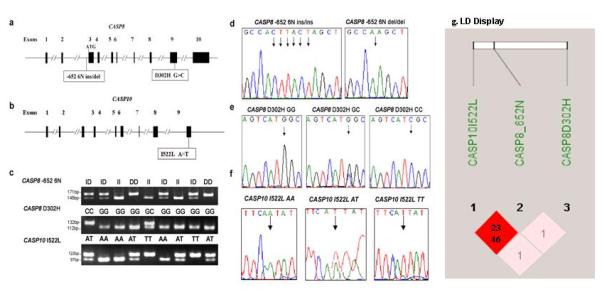
FIGURE 1.

The CASP8 and CASP10 gene structure and genotypes and the CASP8 -652 6N ins/del (rs3834129:–/CTTACT), CASP8 D302H (rs1045485:G>C), and CASP10 I522L (rs13006529:A>T) sites. a: The CASP8 gene structure and locations of the -652 6N ins/del and D302H G>C variants. b: The CASP10 gene structure and locations of the I522L A>T variant. c: Genotyping of CASP8 -652 6N ins/del (ins/ins, ins/del, and del/del), CASP8 D302H G>C (GG, GC, and CC), and CASP10 I522L A>T (AA, AT, and TT) using genomic DNA. d: Direct sequencing results for the CASP8 -652 6N ins/del genotypes (del/del and ins/ins). e: Direct sequencing results for the CASP8 D302H G>C genotypes (GG, GC, and CC). f: Direct sequencing results for the CASP10 I522L A>T genotypes (AA, AT, and TT). g: LD display for CASP8 and CASP10 SNPs. The colors are based on D’ and logarithm (base 10) of odds (LOD): the shaded pink/light gray area represents D’ < 1 and LOD ≥ 2, and the bright red/dark area represents D’ = 1 and LOD ≥ 2. The numbers displayed in the diamonds are the r2*100 for pairwise SNPs: 23 for the HapMap data and 46 for the observed data in this present study.
