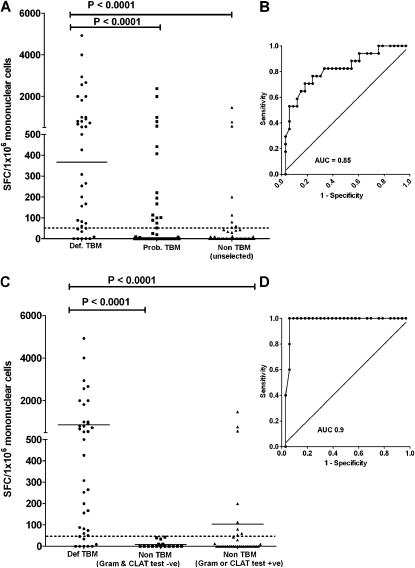
Figure 2.
RD1 antigen–specific responses to early secreted antigenic target 6 and culture filtrate protein 10 using cerebrospinal fluid mononuclear cells comparing definite-, probable-, and non-tuberculous meningitis (TBM) groups. (A) Definite-TBM compared with the unselected non-TBM group and (B) the corresponding receiver operating characteristic (ROC) curve. (C) Responses when the non-TBM group was stratified by rapid test results (gram positive or cryptococcal antigen latex agglutination test [CLAT] positive vs. gram negative and CLAT negative) and (D) the corresponding ROC curve. (C) For clarity, the probable-TBM group is not shown.

