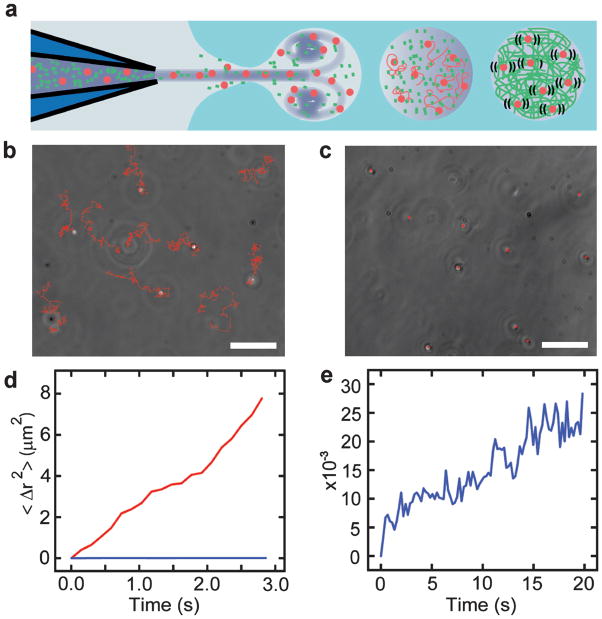
Fig. 5.
Controlled assembly and interrogation of actin networks in lipid vesicles. (a) A mixture of actin monomers and 500 nm fluorescent beads are co-encapsulated in vesicles by microfluidic encapsulation with an inkjet. A polymerization buffer is entrained and mixed with the beads and monomers during encapsulation such that network assembly begins only after vesicles are formed. Diffusion of fluorescent beads is a probe for network viscosity. (b) Free diffusion of individual fluorescent beads (trails marked in red) over 5 s. Scale bar is 10 μm. (c) Diffusion of individual fluorescent beads confined by actin network polymerization (trails marked in red over the same period). Scale bar is 10 μm. (d) Plot of mean squared bead displacement with (blue) and without (red) actin network confinement as a function of time. (e) Zoomed plot of mean squared bead displacement after actin-network assembly. The traces comes from three vesicles and represents the average from 30 beads (10 beads within each vesicle).

