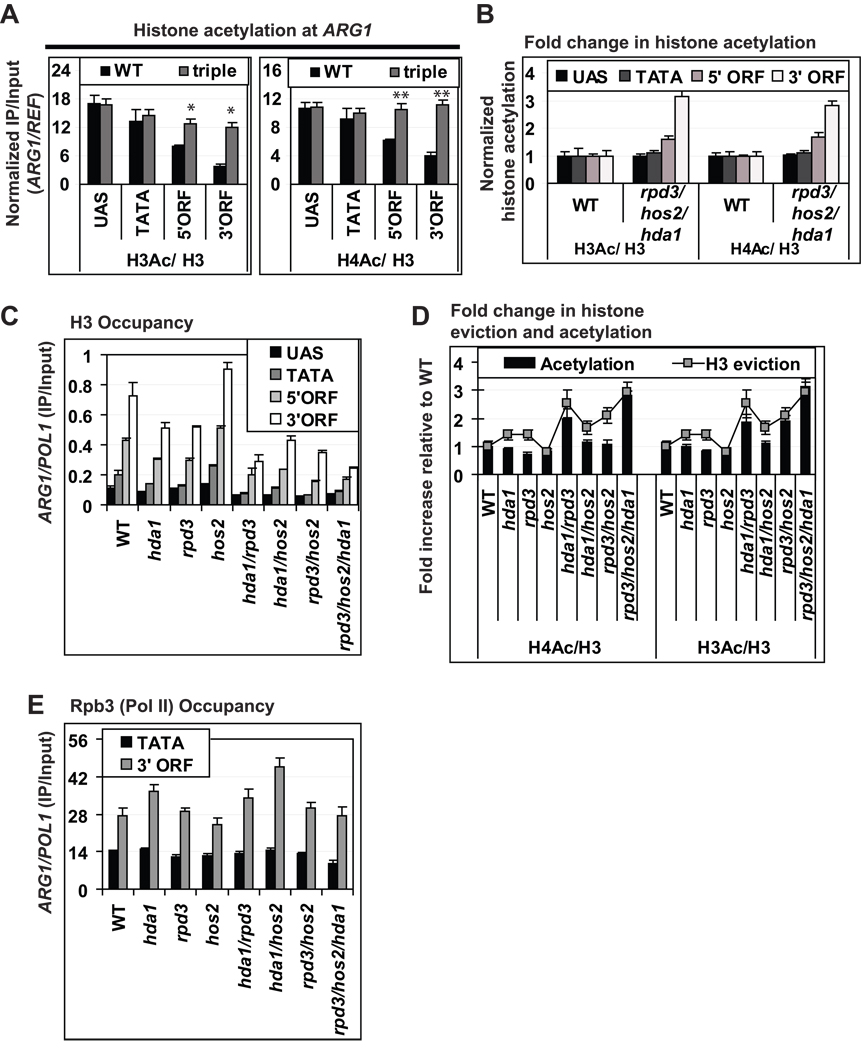
Fig. 6. Direct correlation between co-transcriptional acetylation and eviction of histones in ARG1 coding sequences.
(A) H3Ac/H3 ratios (left) or H4Ac/H3 ratios (right) at ARG1 determined by ChIP for WT and the rpd3Δ hos2Δ hda1Δ triple mutant. *; p value < 0.01 and **; p value < 0.005. (B) H3Ac/H3 and H4Ac/H3 ratios in (A) were normalized to the values in WT cells at each location at ARG1. (C) H3 occupancies at ARG1 measured by ChIP. (D) H3Ac/H3 and H4Ac/H3 ratios determined in (C) and normalized to the WT ratios plotted as a histogram (Acetylation), along with the fold increase in H3 eviction as a line graph (H3 eviction) calculated as the reciprocal of the mutant total H3 occupancies normalized to the WT H3 occupancy. (E) Rpb3 (Pol II) occupancies at ARG1 determined by ChIP. All error bars represent the SEM.

