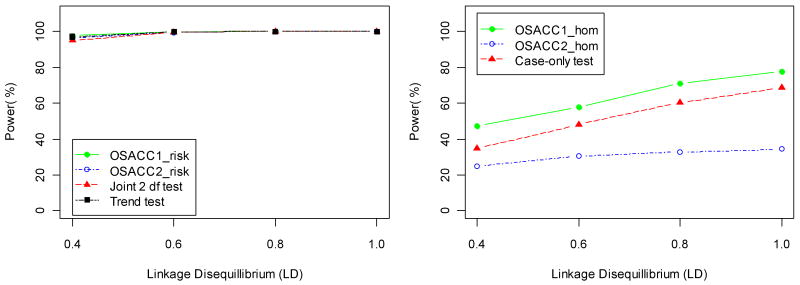
Figure 6.
Power (at significance level 0.05) of the risk tests (left panel) and homogeneity tests (right panel) for the G×E model from Table II as a function of the assumed linkage disequilibrium (r2) between marker and disease allele in the LD subset, for α= 0.7 and OR=2.

