
Figure 10.
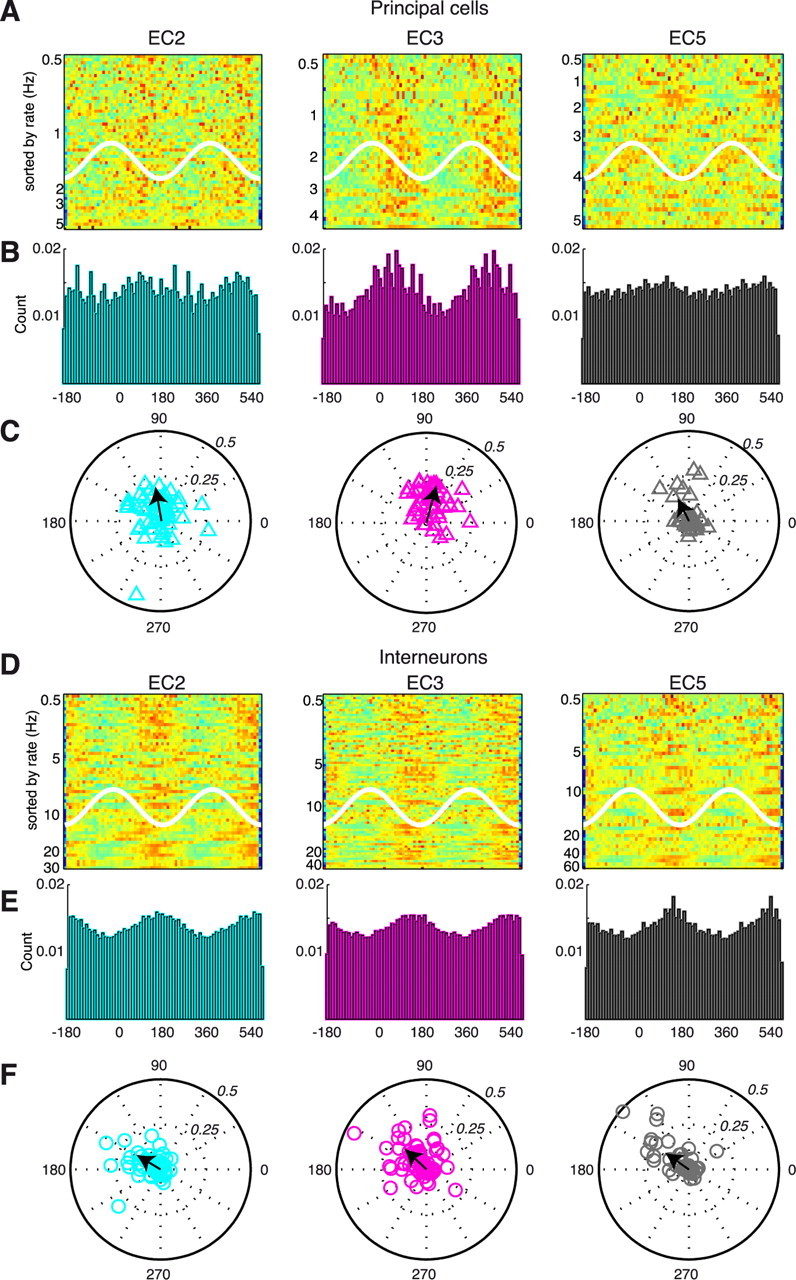
Gamma phase modulation of EC neurons. A, Color-coded discharge probability of physiologically identified, extracellularly recorded EC2, EC3, and EC5 (n = 40) principal cells as a function of local gamma phase (white line). Each row is a single neuron, normalized to its peak firing rate (red = 1). Neurons are sorted according to firing rate (left axis). B, Population discharge probability of the EC principal neuron groups shown in A. All neurons are included, independent of whether their spikes were significantly modulated by gamma phase or not. Bin size, 10°. C, Polar plots of preferred phase and gamma modulation depth of single neurons (symbols) and group mean (black arrows). Only neurons with at least 50 spikes and firing rate >0.5 Hz (Rayleigh test, p < 0.01) are included. D–F, Same display as A–C for physiologically identified EC2 (n = 56), EC3 (n = 73), and EC5 (n = 49) interneurons. Note phase-delayed firing of interneurons relative to principal cells in all layers.