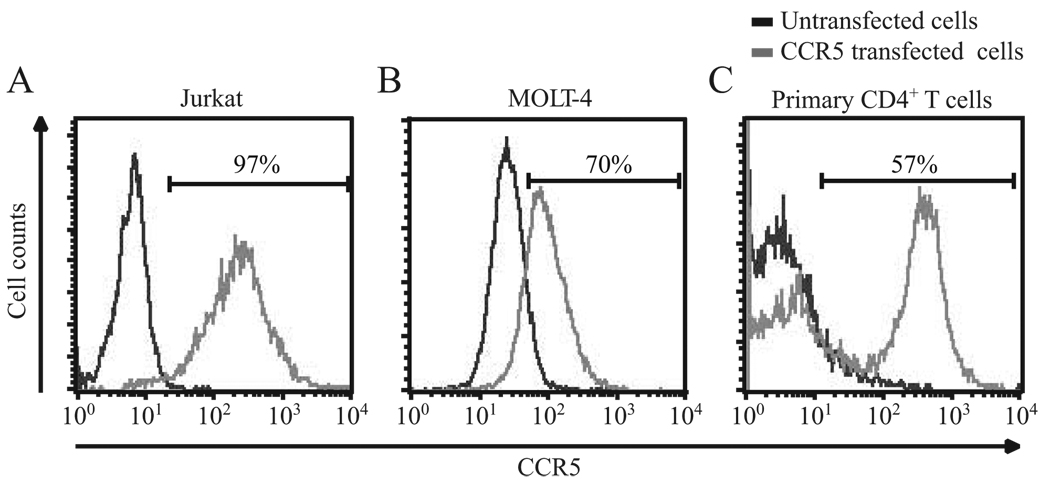
FIGURE 1.
CCR5 surface expression in human T cells. Plots showing the CCR5 surface expression in (A) Jurkat, (B) MOLT-4, and (C) primary human CD4+ T cells before and after engineering cells to overexpress CCR5. In untransfected cells (black lines), dim levels of CCR5 were detected in less than 1%, 3%, and 5% of Jurkat, MOLT-4, and primary CD4+ T cells, respectively. In contrast, very high surface levels of CCR5 were detected in 97%, 70%, and 57% of the cells engineered to overexpress CCR5 (gray lines) in Jurkat CCR5, MOLT-4, and primary CD4+ T cells, respectively. These cells were designated herein as Jurkat/CCR5, MOLT-4/CCR5 and CCR5high cells, respectively. CCR5 mean fluorescence intensity values were also significantly different between untransfected vs CCR5 transfected cells in Jurkat, MOLT-4, and primary human CD4+ T cells, and in these cell types the values were 43 vs 209, 74 vs 112, and 35 vs 271, respectively.

