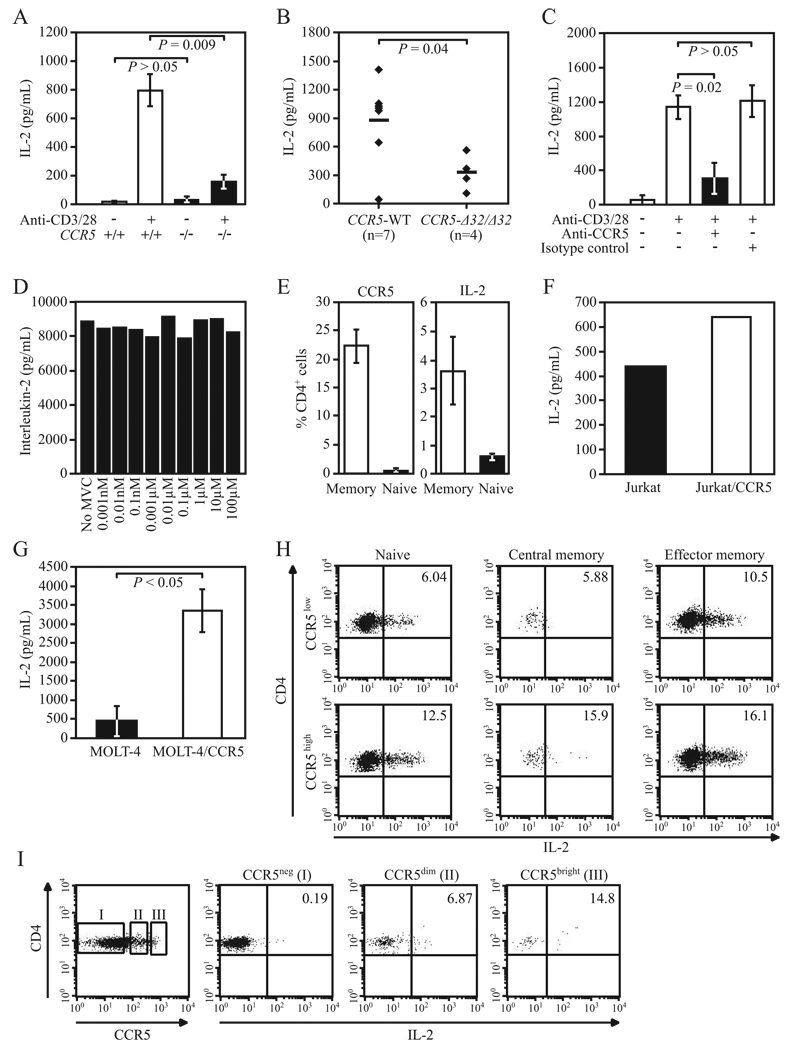
FIGURE 2.
CCR5 expression levels influence IL-2 levels in T cells. A–C, IL-2 levels were measured by ELISA in culture supernatants obtained after 48 h of cell stimulation with anti-CD3 and anti-CD28 Abs; the sources of the cells were (A) purified T cells from C57BL/6J CCR5−/− and CCR5+/+ mice (data from three independent experiments), (B) PBMC from CCR5 WT (i.e., those lacking the CCR5-Δ32 allele) and CCR5-Δ32/Δ32 healthy individuals (n = no. of individuals/group), and (C) PBMC from three CCR5 WT healthy donors preincubated with anti-CCR5 or nonspecific isotype control Abs. Data in A and C are means ± SEM, and in B, horizontal lines reflect mean values. D, Purified human T cells were treated with different concentrations of maraviroc (0.001 nM to 100 µM; Selzentry; Pfizer) for 1 h at 37°C followed by stimulation with plate-bound anti-CD3 Ab (1 µg/ml; BD Pharmingen) and soluble anti-CD28 Ab (0.5 µg/ml; BD Pharmingen). IL-2 levels were measured by ELISA in culture supernatants after 48 h of stimulation. Results are representative of four experiments. E, Surface levels of CCR5 and intracellular levels of IL-2 were measured at the single cell level by FACS in PBMC from five healthy donors. Histograms correspond to percentage (mean ± SEM) of memory (CD45RO+) and naive (CD45RO−) CD4+ cells expressing CCR5 (left) and IL-2 (right). F, Representative data of IL-2 levels measured by ELISA in culture supernatants of CCR5 overexpressing Jurkat T cells (Jurkat/CCR5) and native Jurkat T cells after 24 h of stimulation with PMA/ionomycin. Data are representative of two independent experiments. G, Experimental approach as in E, but using native MOLT-4 and MOLT-4/CCR5 T cells. Data (mean ± SEM) are from three independent experiments. H, FACS plots showing CD3/CD28-induced IL-2 production (see x-axis; numbers in upper right box indicate percentage of IL-2-producing cells in naive (CD45RO−CCR7+), central memory (CD45RO+CCR7+), and effector memory (CD45RO+CCR7−) primary human CD4+ T cells before (top panels; CCR5low: CCR5 surface expression <5%) and after overexpression of CCR5 using a lentiviral system (bottom panels; CCR5high: CCR5 surface expression ~60%). I, IL-2 expression correlates with CCR5 expression. Leftmost panel shows the extent of intracellular expression of CCR5 in primary human CD4+ cells. I, II, and III indicate, respectively, CCR5-negative (CCR5neg), CCR5-positive dim (CCR5dim), and CCR5-positive bright (CCR5bright) CD4+ cells. The next three panels show the extent of intracellular expression of IL-2 in these three groups of CD4+ cells. Results are representative of three independent experiments.

