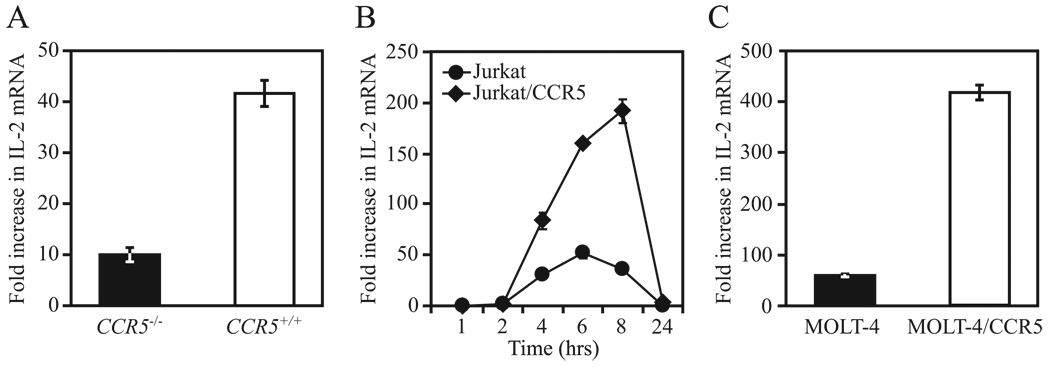
FIGURE 3.
CCR5 surface expression levels influence IL-2 transcript levels. A, IL-2 mRNA levels (mean ± SEM) were determined by quantitative RT-PCR in purified T cells from C57BL/6J CCR5−/− and CCR5+/+ mice after 4 h of stimulation with anti-CD3/28 Abs. Data are representative of three independent experiments. B, IL-2 mRNA levels determined by quantitative RT-PCR in Jurkat T cells overexpressing CCR5 (Jurkat/CCR5) and native Jurkat at the indicated time points after stimulation with PMA/ionomycin. Results are representative of three independent experiments. C, Experimental protocol is as in B except using MOLT-4 and MOLT-4/CCR5 cells. IL-2 mRNA levels (mean ± SEM) were assessed after 6 h of stimulation. Results are representative of three independent experiments.

