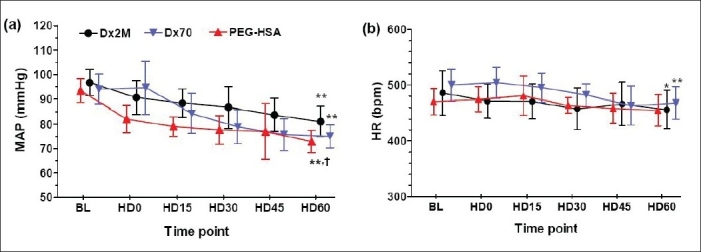
Figure 3.

(a) Mean arterial pressure (MAP) and (b) heart rate (HR) measured at baseline (BL), at 0, 15, 30, 45 and 60 minutes after hemodilution (HD0, HD15, HD30, HD45, HD60). Values are presented as means ± SD. *P<0.05; **P<0.01 compared with baseline in a same group. † P<0.05 compared with the Dx2M group.
