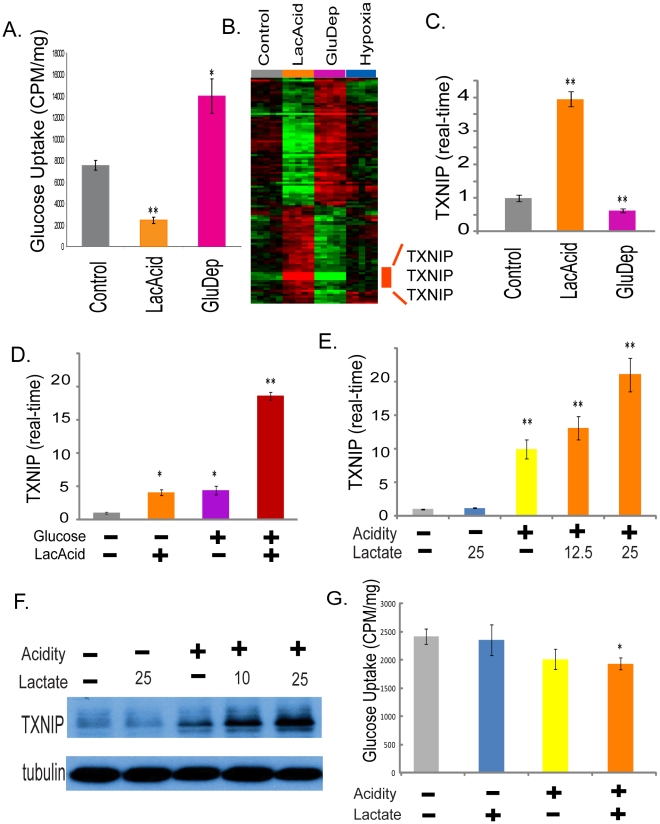
Figure 3. The induction of TXNIP under lactic acidosis.
(A) The amount of glucose uptake of the MCF-7 under control, lactic acidosis and glucose deprivation conditions. (B) Heat map shows expression of the 115 selected probe sets in MCF-7 placed in control, lactic acidosis, glucose deprivation and hypoxia for four hours with the probe sets for TXNIP highlighted. (C) The level of TXNIP transcripts determined by real-time PCR in the MCF-7 under indicated conditions. (D) The level of TXNIP transcripts determined by real-time PCR in the MCF-7 under the four indicated conditions for lactic acidosis and glucose level. (E, F) The level of TXNIP determined by real-time PCR (E) and Western blot (F) in the MCF-7 under five indicated conditions with or without acidity (pH 6.7) and carrying levels of lactate (10, 12.5 or 25 mM). (G) The amount of glucose uptake of the MCF-7 under control, acidosis, lactosis (25mM) and lactic acidosis (25mM) conditions.

