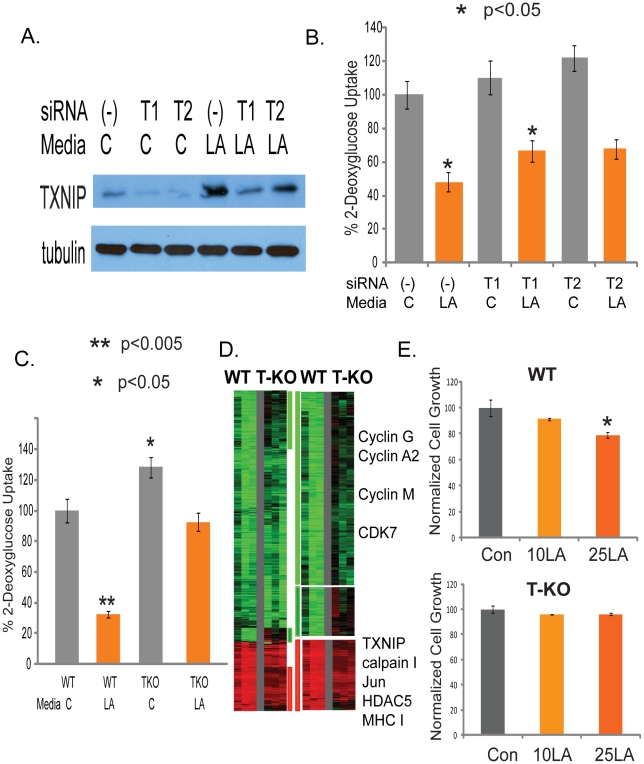
Figure 4. Identification of TXNIP as a regulator of lactic acidosis response.
(A) The level of TXNIP proteins treated with control or siRNAs against TXNIP under control or lactic acidosis conditions. (B) The level of glucose uptake in the MCF-7 treated with the indicated conditions. Lactic acidosis caused 52% repression of glucose uptake in MCF7 cells transfected with non-targeting siRNAs (-) as negative control. In cells transfected with two different siTXNIPs (T1, T2), glucose uptake was increased and the repressing effect of lactic acidosis was decreased to 39% and 44% respectively. (C) Lactic acidosis caused 68% repression in wild-type (WT) MEF cells but only 28% repression in TXNIP knockout (TKO) MEF cells. (D) The gene expression response of wild type and TXNIP deficient MEF cells was shown when exposed to 10mM lactic acidosis conditions. 1327 probes sets showing with at least 1.7 fold changes in at least two samples were selected and arranged by hierarchical clustering according to similarities in expression patterns. Clusters of genes whose induction and repression was most affected by TXNIP are marked and further expanded with the names of selected genes shown. (E) The effect of the control and lactic acidosis (10mM LA and 25mM LA) on the cell growth in percentage of the wild type and TXNIP deficient MEF cells.

