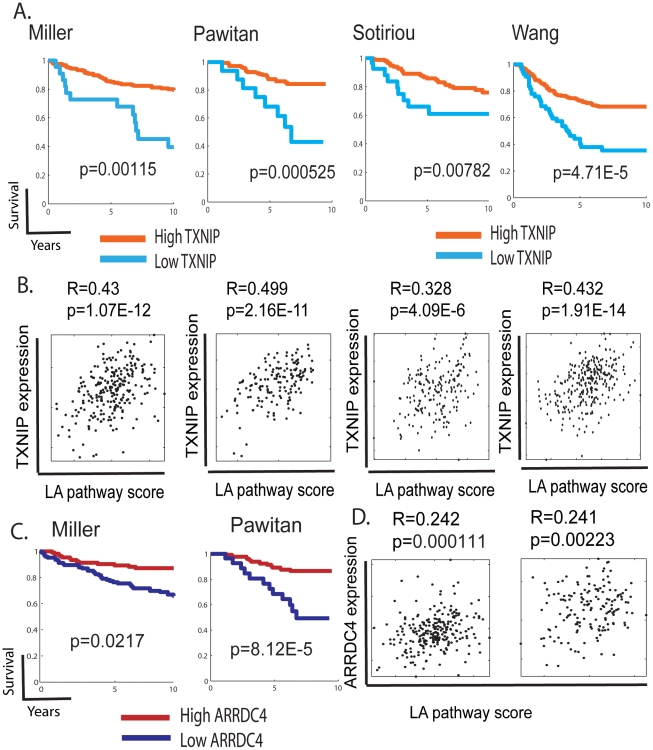
Figure 6. The expression of TXNIP, ARRDC4, and lactic acidosis pathways in human cancers.
(A,C) The tumors in the indicated dataset stratified by the expression of TXNIP (A) and ARRDC4 (B) were used to generate Kaplan-Meier survival curves for linking clinical outcomes with the TXNIP expression levels. (B,D) Scatter plots showing the relationship between the expression of TXNIP (B) or ARRDC4 (D) (Y-axis) and predicted lactic acidosis pathway activities based on the MCF-7 12 hour lactic acidosis gene signatures (X-axis) in the indicated tumor datasets. Each point in the scatter plots represents a single tumor from the indicated breast cancer data sets. The overall correlation (R) and statistical significance/p-value (p) across all samples is shown.

