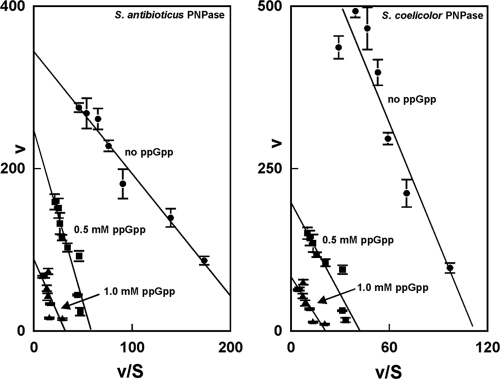
FIG. 2.
Eadie-Hofstee plots of kinetic data for S. antibioticus and S. coelicolor PNPases in the polymerization reaction. Kinetic assays were performed as described previously (25) and in Materials and Methods. Velocities are expressed as pmol min−1, and substrate concentrations are indicated in mM. The data in the figure are averages of two sets of duplicates ± the SEM. The kinetic parameters were calculated from the regression statistics corresponding to the slopes and intercepts of the plots.

