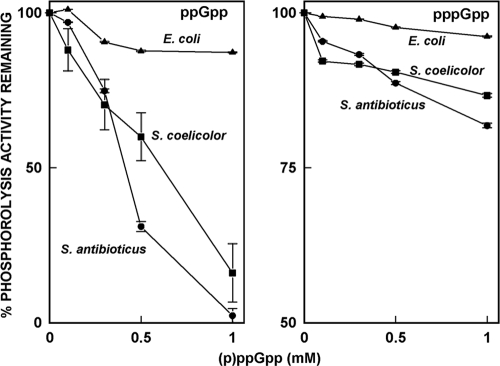
FIG. 3.
Inhibition of the phosphorolysis activity of PNPase by (p)ppGpp. In this figure, the 100% value is the level of phosphorolysis observed in the absence of ppGpp for each enzyme, and lower percentages reflect the inhibition of phosphorolysis by ppGpp. The data in the figure are the averages of duplicates from two separate experiments ± the SEM.

