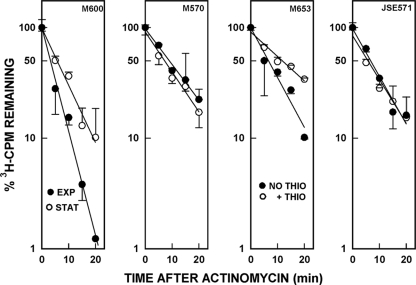
FIG. 5.
Decay curves of bulk mRNAs in various S. coelicolor strains. Cultures were grown and treated as described in Materials and Methods, and actinomycin D was used to inhibit transcription. Measurements were made during exponential (EXP) and stationary (STAT) phases for M600 and M570 and during stationary phase for M653 and JSE571. Samples of the latter two strains were also treated with thiostrepton to induce expression of the tipA promoter. The cpm values obtained at each time point were plotted as a percentage of the cpm present at time zero, set arbitrarily as 100. The data in the figure are the averages of duplicate measurements from two independent experiments ± the SEM.

