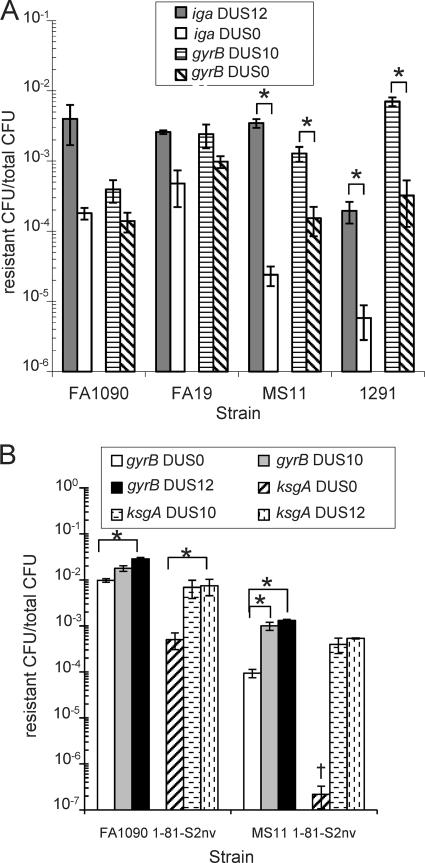
FIG. 2.
The magnitude of DUS enhancement of transformation is strain dependent (A), and DUS phenotypes are not due to pilin sequence or pilin antigenic variation (B). (A) Strains FA1090, FA19, MS11, and 1291 were quantitatively transformed with iga::cat DUS0 and DUS12 and gyrB1 DUS10 and DUS0 plasmid DNA. Transformation efficiencies are plotted as resistant CFU/total CFU. Gray bars indicate iga::cat DUS12, white bars indicate DUS0 iga::cat, horizontal dashed lines indicate gyrB1 DUS10, and diagonal lines indicate gyrB1 DUS0 DNA. Error bars are SEM. *, P < 0.05 by Student's t test. (B) Strains FA1090 1-81-S2nv and MS11 1-81-S2, which cannot undergo pilin antigenic variation and are isogenic for pilE, were quantitatively transformed with gyrB1 and ksgA1 DUS0, DUS10, and DUS12 plasmid DNA. Transformation efficiencies are plotted as resistant CFU/total CFU. White bars indicate gyrB1 DUS0, gray bars indicate gyrB1 DUS10, black bars indicate gyrB1 DUS12, diagonal stripes indicate ksgA1 DUS0, horizontal dashed lines indicate ksgA1 DUS10, and vertical dashed lines indicate ksgA1 DUS12 plasmid DNA. Error bars are SEM. †, 2 repeats below limit of detection. *, P < 0.05 by Student's t test.

