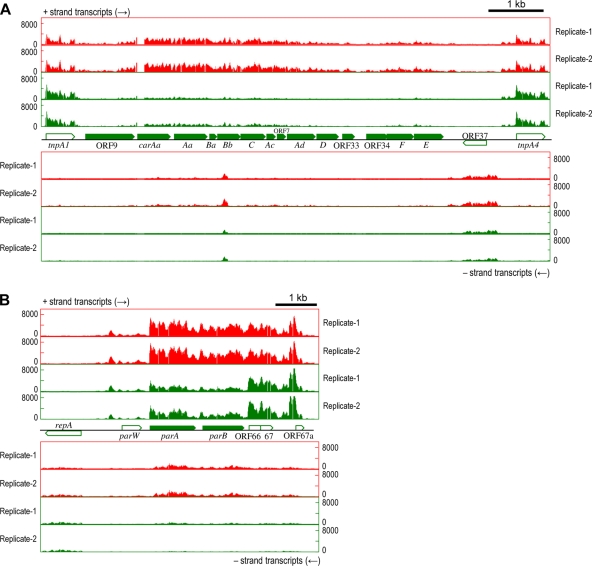
FIG. 4.
RNA maps of downregulated genes on pCAR1 by pmr disruption of the flanking regions of the car operon (A) or parAB genes (B). The x axis indicates the position in pCAR1, and the y axis indicates the signal intensities of hybridization with single-stranded cDNA. Each bar denotes the signal intensity of each probe: red bars represent RNA maps of pCAR1-containing KT2440, and green bars represent those of the pmr disruptants. The results of two biological replicates (Replicate-1 and -2) are shown. Pentagons indicate the directions and locations of the annotated genes.

