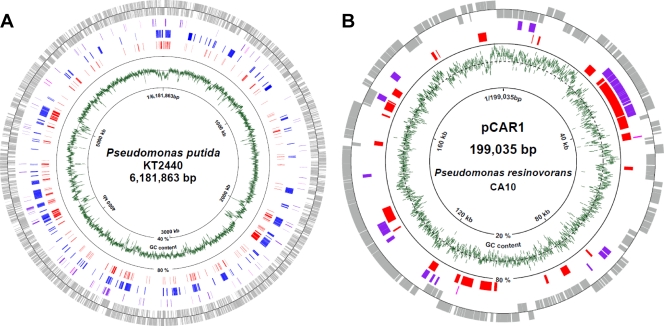
FIG. 6.
Distribution of Pmr-binding sites on the P. putida KT2440 chromosome (A) or pCAR1 (B). Genes or ORFs (gray) outside the circle are coded clockwise, while those inside are coded counterclockwise. Genes upregulated or downregulated by pmr disruption are shown in purple and magenta, respectively. Putative horizontally acquired DNA regions in the KT2440 chromosome (24) are shown in blue. The Pmr-binding regions detected in this study are shown in red. The green line indicates the average G+C content of genomic DNA (KT2440, 1,000-nt span; pCAR1, 100-nt span). The broken-line circle indicates the average G+C content of the entire KT2440 (61.6%) or pCAR1 (56.3%) genome.

