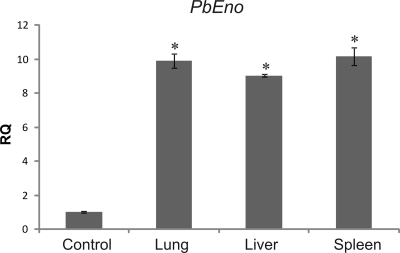
FIG. 6.
Analysis of enolase transcripts by quantitative real time RT-PCR. qRT-PCR plot of PbEno expression levels of transcripts from yeast cells of P. brasiliensis derived from lungs, livers, and spleens of mice after 7 days of infection. Control systems consisted of yeast cells from cultures inoculated in BHI agar. The primers were as follows: sense, 5′-GATTTGCAGGTTGTCGCCGA-3′; antisense, 5′-TGGCTGCCTGGATGGATTCA-3′. The expression values were standardized using the expression values for the constitutive gene encoding the protein tubulin. The relative quantification (RQ) of the experiment was performed in triplicate. The error bars indicate the standard deviations from three independent experiments performed in triplicate. *, significantly different from the control, at a P value of <0.05.

