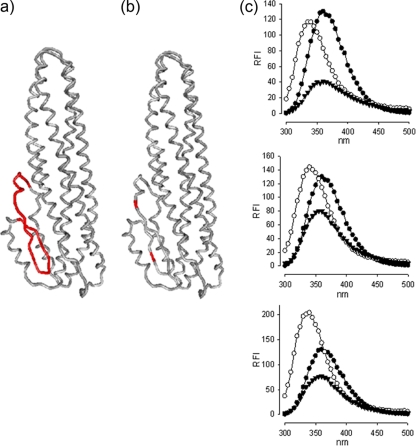
FIG. 1.
Structural models of mutated NheC. (a and b) Locations of the hydrophobic region (shown in red [a]) and the two cysteine residues (b) within NheC that were replaced to create NheChr− and NheCcys−. The structure was modeled on HblB (Protein Data Bank identification 2nrj) using Swiss Expasy and drawn using 3D-mol. (c) Intrinsic tryptophan fluorescence spectra of NheC (top), NheChr− (middle), and NheCcys− (bottom) are shown as relative fluorescence intensity (RFI). Proteins were between 5 and 8 μg ml−1 in 25 mM Tris buffer, pH 7.4, at 25°C, and fluorescence scans are shown before (○) and after (▾) 5 min in 8 M urea. Buffer traces are subtracted. The data points are shown only for every 5 nm to aid clarity. Tryptophan HCl (•, 1 μM) is shown for reference in all traces. The absolute RFI values differ due to the variation in concentration of the different NheC preparations. Note the red shift in all three proteins in 8 M urea as well as the drop in fluorescence intensity.

