FIG. 3.
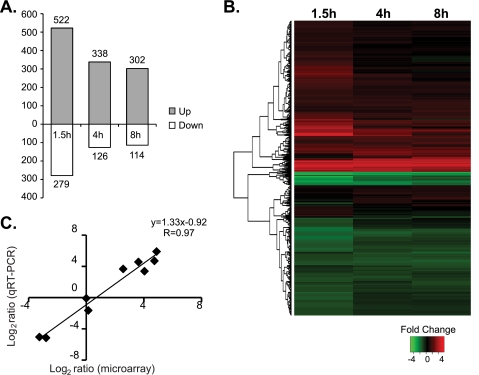
Transcriptional profiling of intracellular Y. pestis KIM5. (A) Numbers of Y. pestis genes significantly up- or downregulated inside macrophages at various times postinfection compared to the level of expression by Y. pestis cells grown in Dulbecco modified Eagle tissue culture medium. (B) Hierarchical clustering of differentially regulated Y. pestis genes. Each horizontal line indicates one gene. The fold change in the mRNA expression level of each gene is represented according to the color key shown below the heat map. Genes with similar expression patterns are grouped together on the basis of the clustering, and the dendrogram on the left shows those relationships. (C) Validation of microarray results by qRT-PCR. qRT-PCR was performed with nine genes that encompassed a range of expression levels in the microarray experiments. The results were normalized to the level of expression of 16S rRNA. Eight out of nine genes showed the differential regulation in the same direction. The only exception was Y0052 (yopB), which had +1.1-fold change by microarray analysis but a −1.8-fold change by qRT-PCR. The results of the linear regression analysis are shown above the graph.

