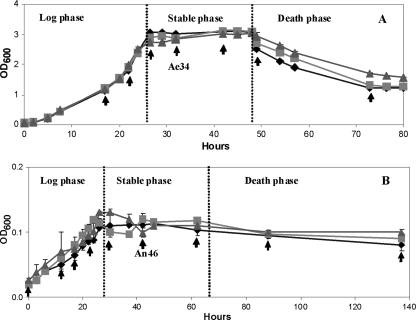
FIG. 1.
Profile of S. oneidensis MR-1 growth under aerobic (A) and anaerobic (B) conditions. Each point shows the biological repeats from 3 measurements, and the error bars indicate standard deviations. The arrows represent samples collected for metabolic analysis. The coding is such that Ae34 is from cells grown aerobically for 34 h and An46 from cells grown anaerobically for 46 h.

