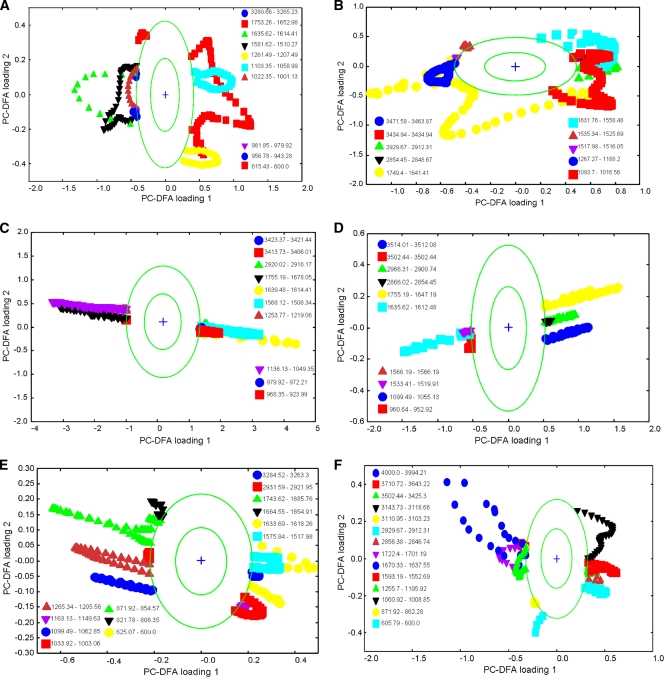
FIG. 4.
PC-DFA plots for FT-IR spectra of S. oneidensis MR-1 cells. PCs 1 to 20 (accounting for 99.5% of the total explained variance) were used by the DFA algorithm with a priori knowledge of machine replicates (i.e., 1 class per sample point, giving 17 classes in total). The different symbols represent the different sample points. The circles represent a boundary of 2 standard deviations from the loading centroid, and this is used to give a nonstatistical approximation of a 95% confidence interval (this aid to visualization highlights bands which are changing the most). The order of these plots is the same as that in Fig. 3: (A) combined aerobic and anaerobic samples; (B) early-exponential- and stationary-phase samples grown aerobically and anaerobically; (C) combined anaerobic samples; (D) early-exponential- and stationary-phase samples grown anaerobically; (E) combined aerobic samples; (F) early-exponential- and stationary-phase samples grown aerobically.

